

Weekly Market Recap 5/1/26
Grains traded with moderate volatility this week, supported early by rising crude oil prices and weather concerns before seeing profit-taking into month-end. Wheat outperformed the complex with strong mid-week gains, while corn showed modest strength and soybeans remained range-bound. Livestock futures continued their bullish trend on tight supplies, cotton posted sharp moves, crude oil spiked on geopolitical tensions, and the S&P 500 faced headwinds from higher energy costs.
Grains
Corn: Nearby July corn rallied early in the week, testing five-week highs before settling around $4.795. December new-crop corn pushed above the key $5.00 psychological level, closing at $4.9825. Daily price action showed solid buying interest early, driven by export sales and energy strength.
Soybeans: July beans traded sideways in a tight range between $11.85–$12.05, closing the week at $12.015. November new-crop beans displayed slightly better relative strength, closing the week at $11.8075.
Wheat: Chicago SRW July wheat led early gains, hitting contract highs near $6.715 mid-week before fading to settle at $6.3775.
KC HRW July wheat was the strongest performer, briefly trading above $7.00 on drought concerns, then giving back some gains on profit-taking and closed at $6.945.
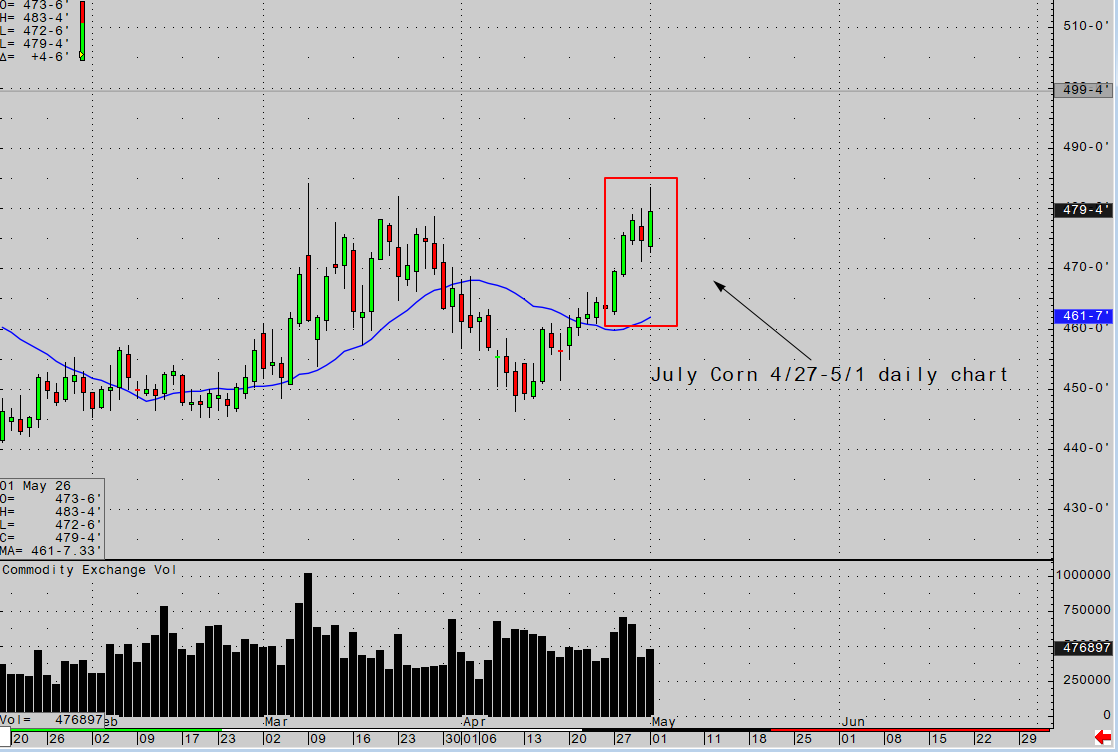
July Corn chart
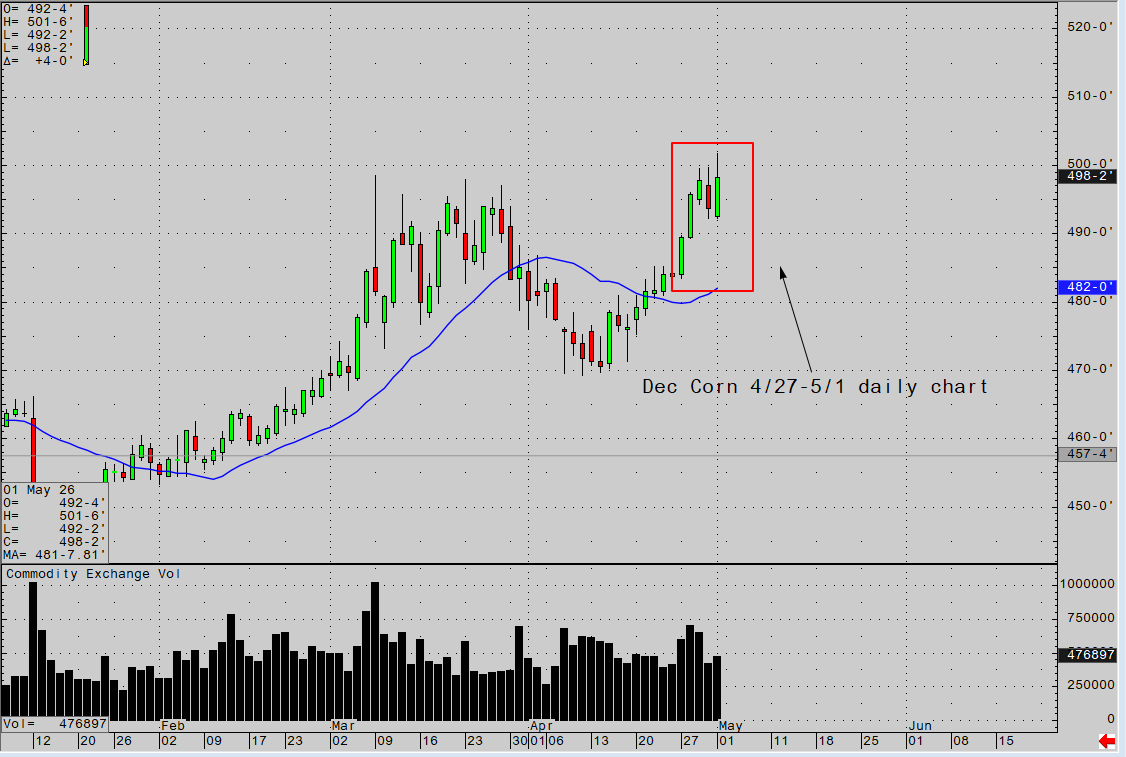
Dec Corn Chart
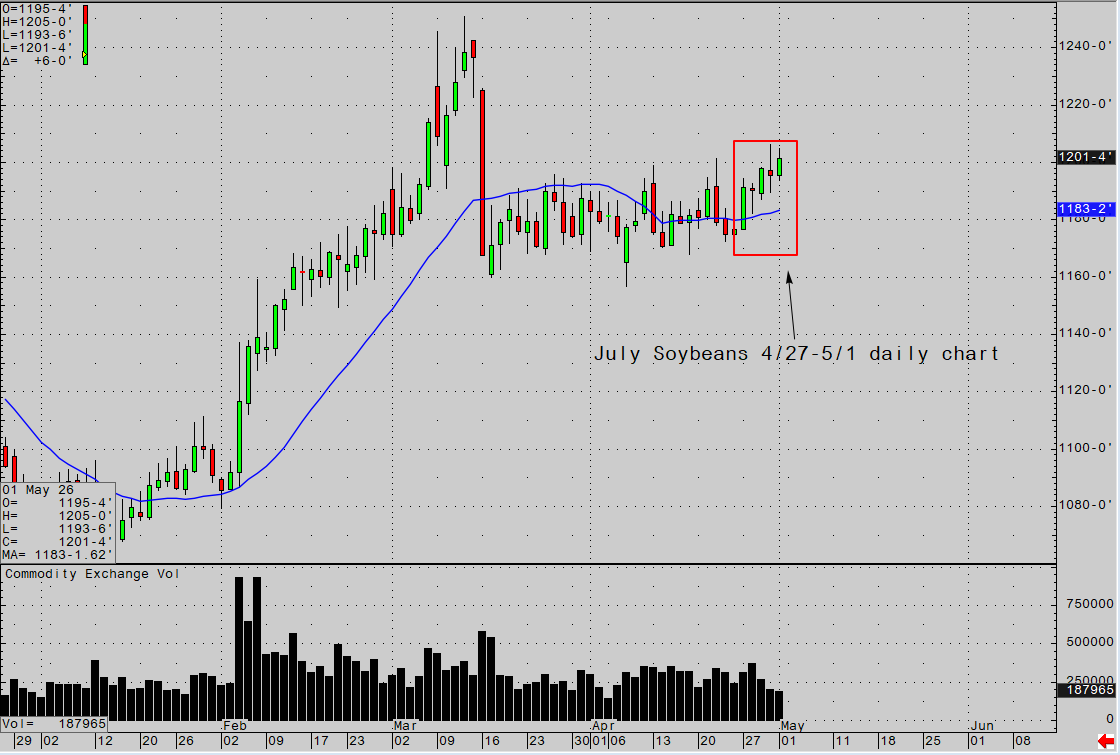
July Soybean chart
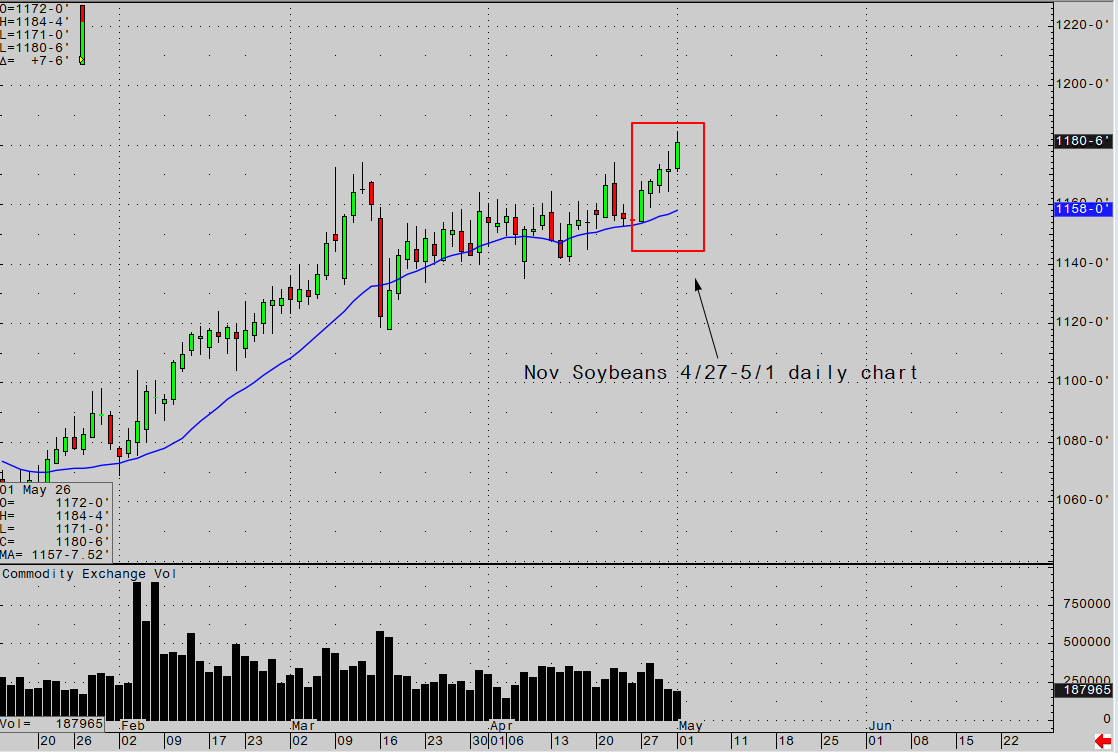
Nov Soybean chart
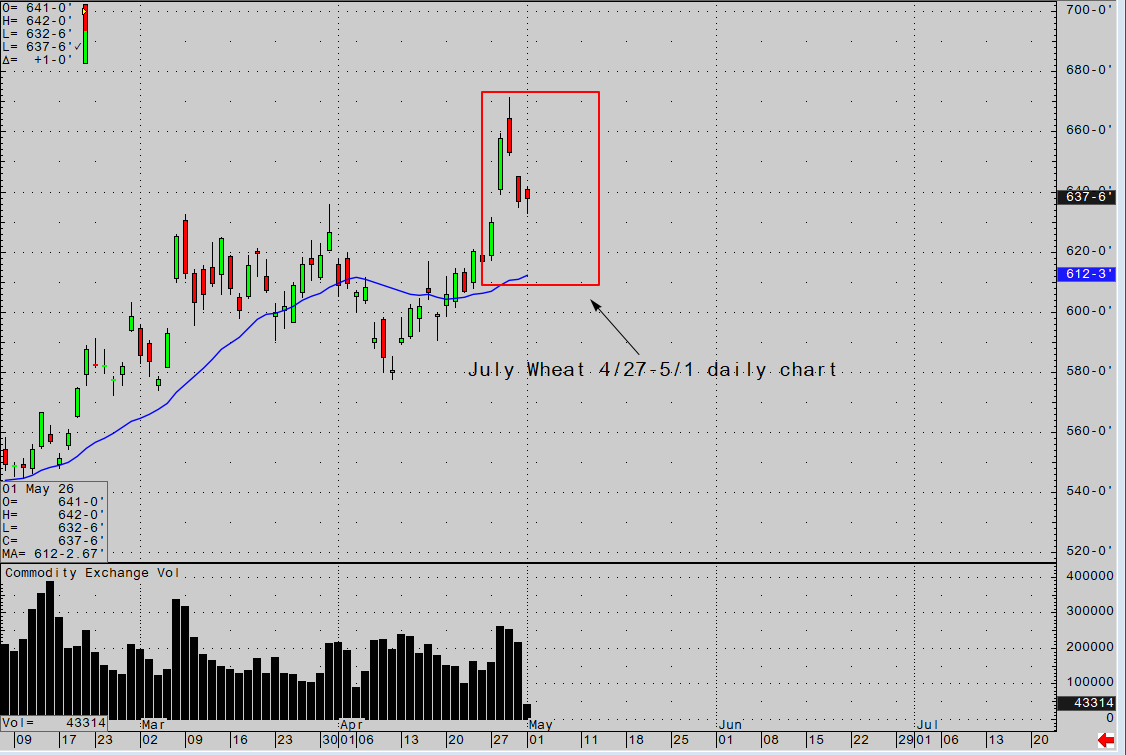
July Chicago Wheat chart
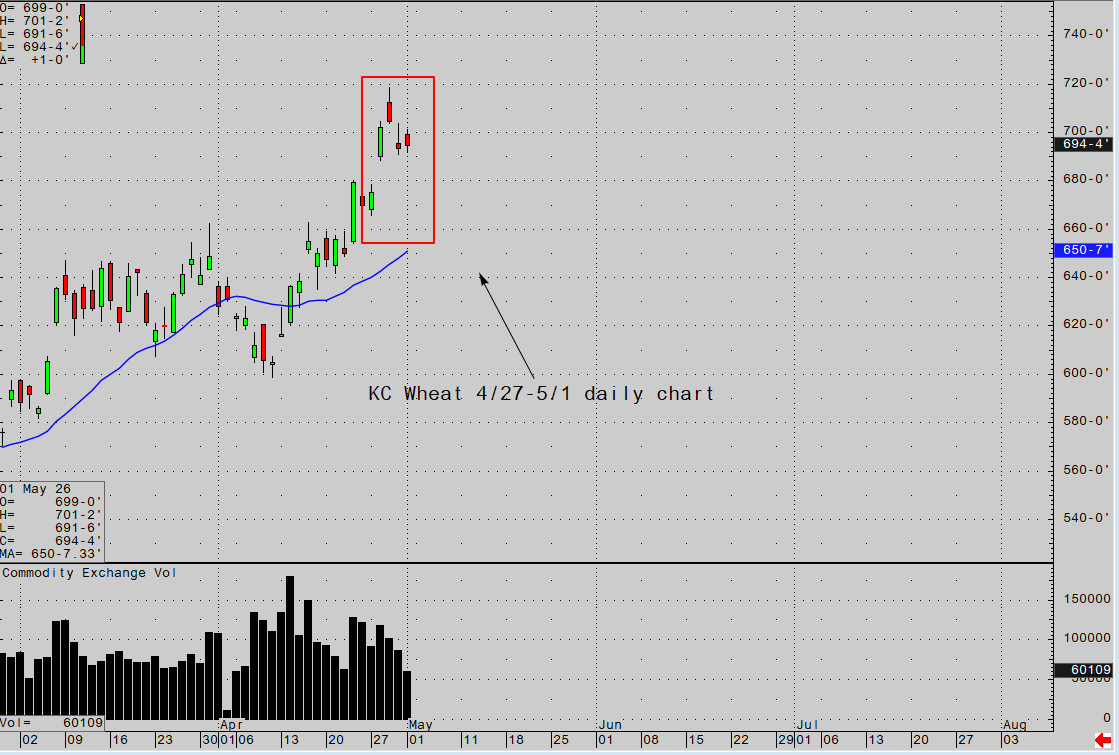
July KC Wheat chart
Livestock
Live Cattle: Bullish throughout the week. June live cattle continued making new record highs, hitting $255 and closing at $253 with cash markets remaining strong. December closed at $241.85.
Feeder Cattle: Held steady to slightly higher, closing August at $372.175. The complex benefited from strong feeder demand and supportive live cattle prices. The November contract closed at $365.825
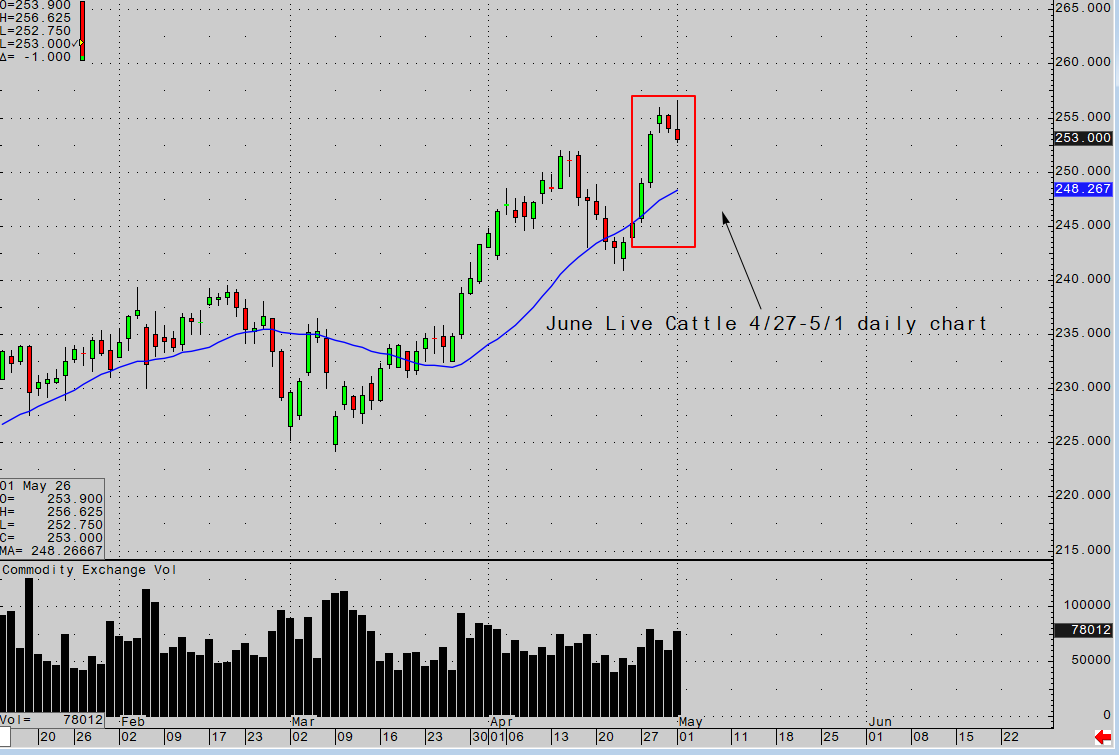
June Live Cattle Chart
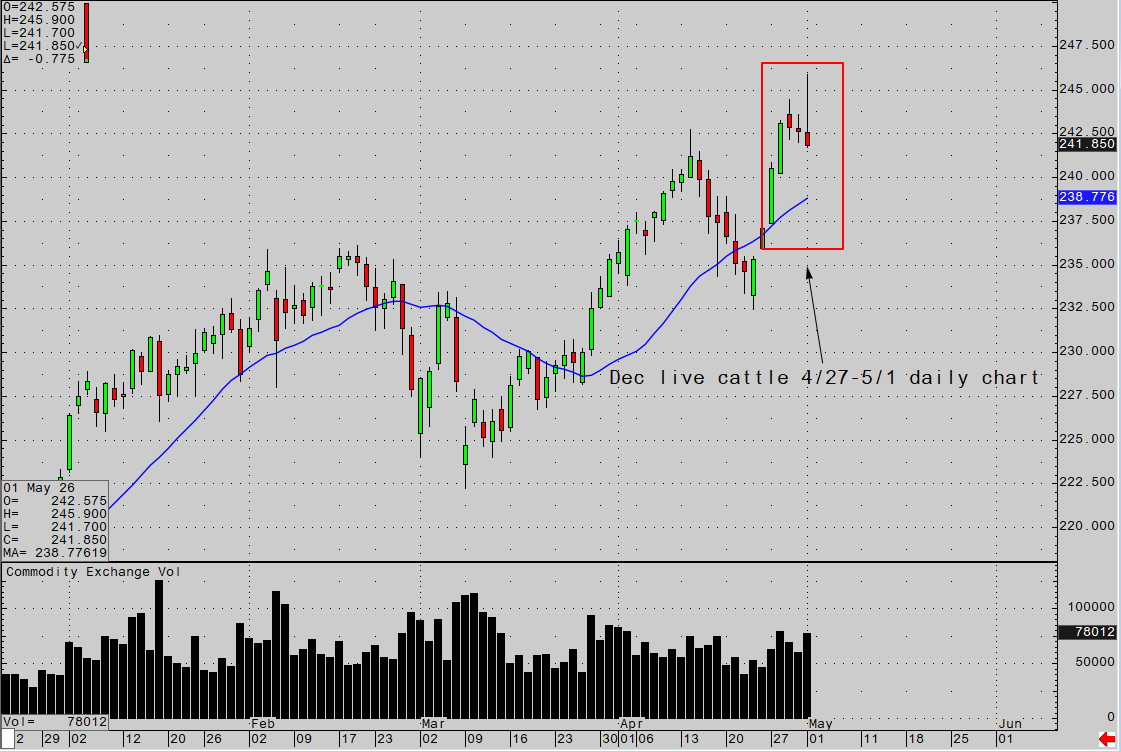
Dec Live Cattle Chart
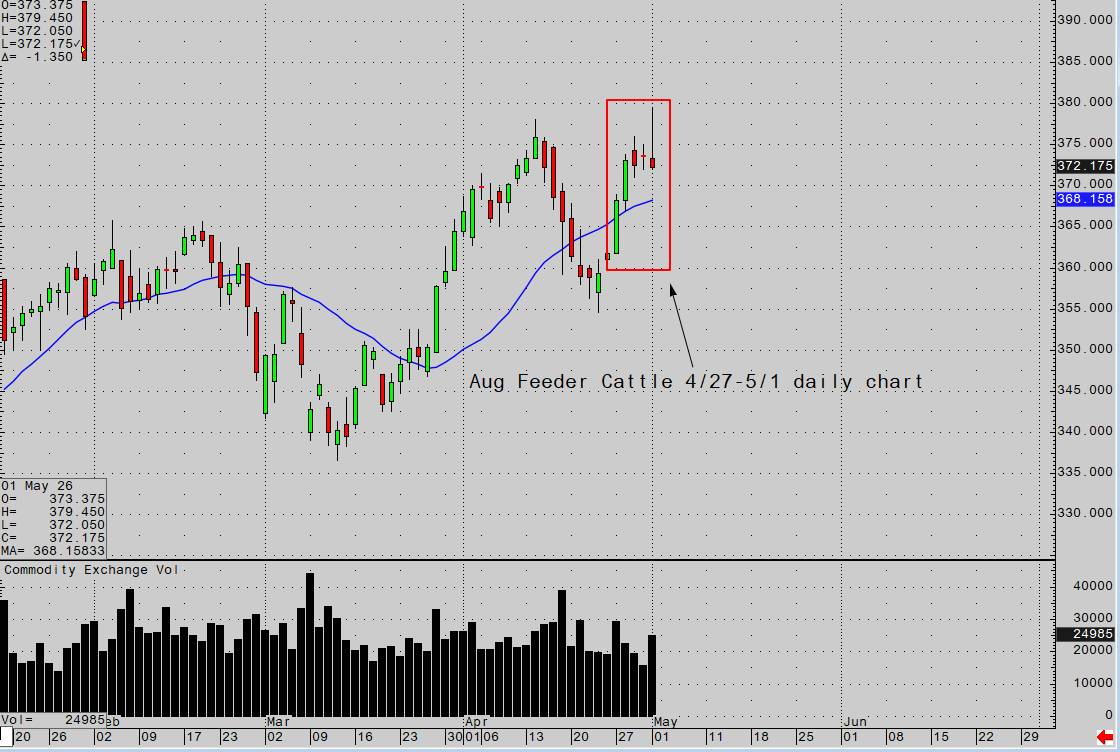
Aug Feeder Cattle chart
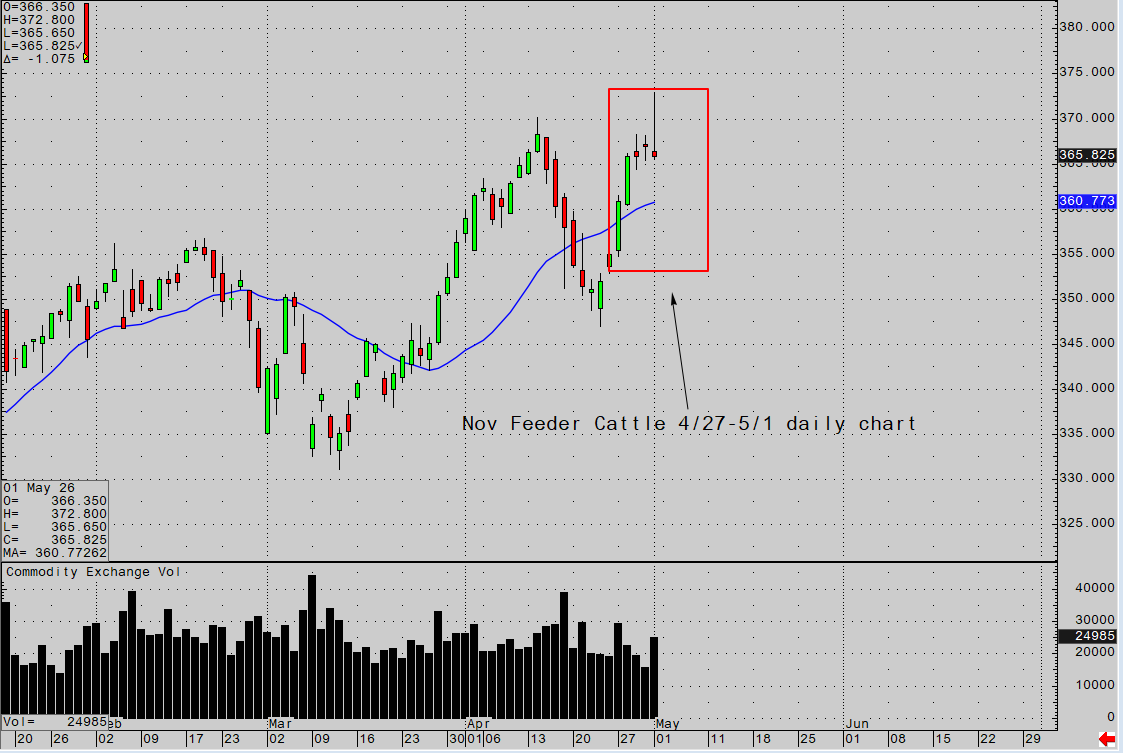
Nov Feeder Cattle chart
Softs & Energy
Cotton: Highly volatile. July cotton saw aggressive rallies, fueled by strong mill demand and weather-related supply concerns which led to a close at $84.19.
Crude Oil: One of the biggest movers of the week. June WTI crude surged sharply on geopolitical risks tied to the peace deal proposed by Iran late in the week. This led to a sharp move from new highs back down to the weekly lows closing at $102.25.
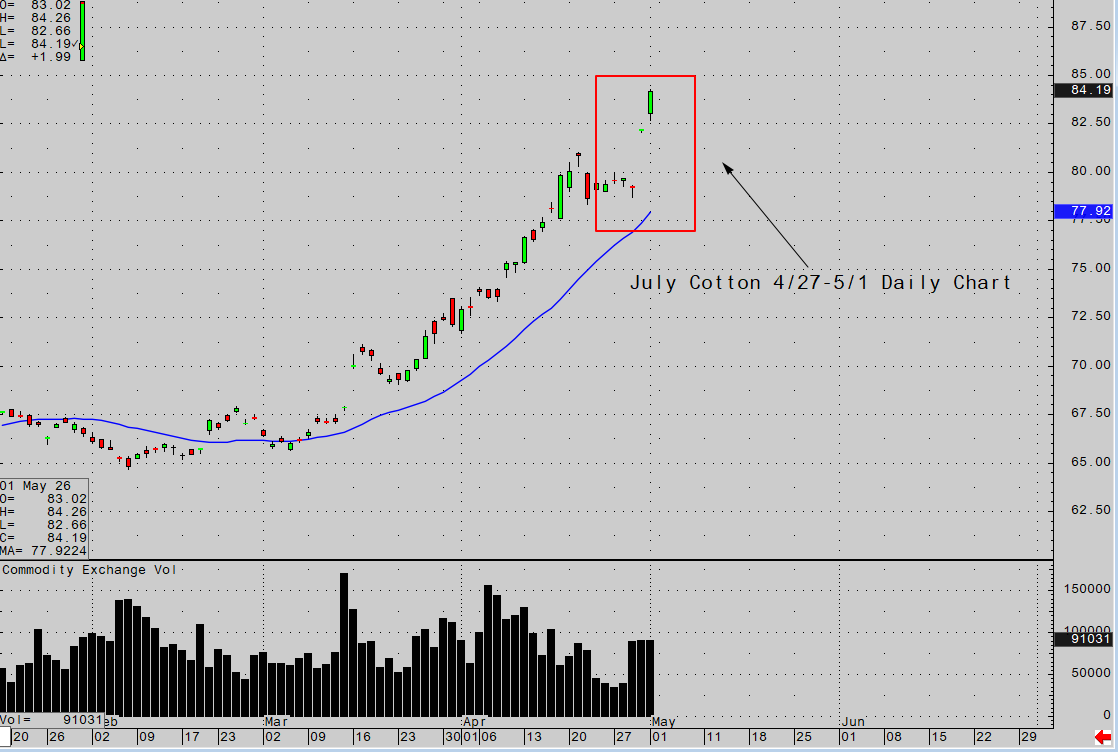
July Cotton chart
Equities
S&P 500: The S&P 500 continued its upward trend this week, reaching new all-time highs and extending gains. The index showed strong buying interest and maintained positive momentum despite rising oil prices with a high of $7300 and closing at $7247.75.